A Matter of presentation
Cheating with Diagrams
"Foul Business Behaviour Ltd.", a company with a long history of successful cheating its partners, customers and employess, want to cheat their owners, i.e. the shareholders, for a change. To this purpose it's necessary to posh up its sales figures to present it to its owners. They are fully aware of the fact that shareholders are a species which are not wasting their time on mawkish sensitivity, but focus solely on shareholder value. Besides that, they are extremely sensitive towards slumps in profits, even if they are quite small. So, the "Foul Business Behaviour"-management has to be extremely careful how to present the figures of their sales report.
Mr. Lovetolie and Dr. Packoflies, great exports in lying with staticics, are entrusted with this tricky problem. Though the sales revenues of the last two years are tending upwards, they have to hide the slumps in sales of the previous years, i.e. 2001 and 2003. (Something which is already well hidden in these numbers is the fact, that though sales seem to be higher than all these years before, the company has had it highest losses since is was founded. The reason is, that they had extraordinary sellings of some of its real estate and patents, which tehy will not be able to reat in the following years. But this can be only found in the small print of the annual report.
But let us concentrate on our two specialists in mathematics and statistics and how they cope with their problem:
| Year |
Sales in Millions of Euro |
| 2000 |
127,00 |
| 2001 |
123,40 |
| 2002
|
126,90 |
| 2003 |
123,23 |
| 2004 |
134,08 |
| 2005 |
137,79 |
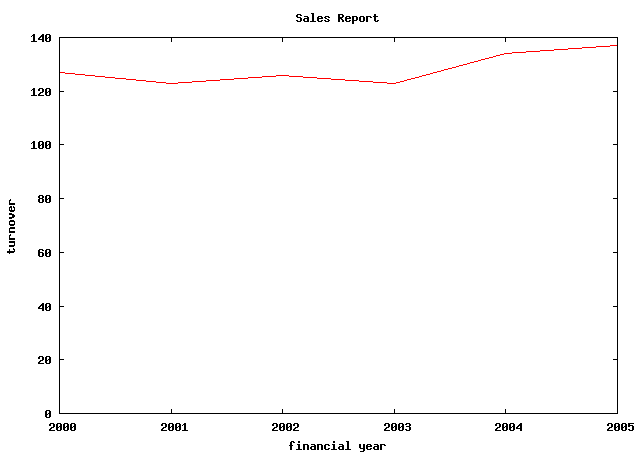
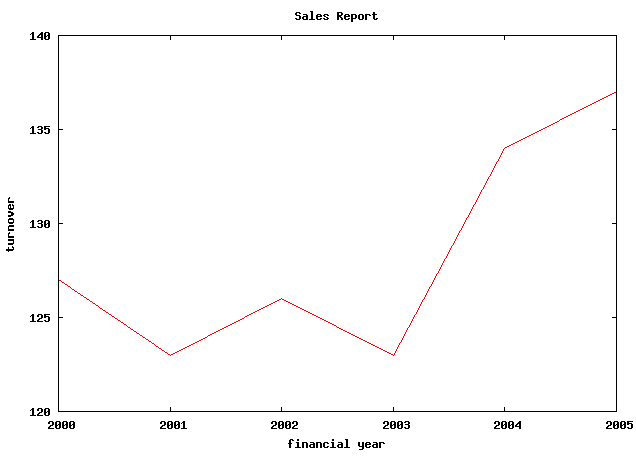
Dr. Packoflies recognizes that this diagram is not giving their sales figures a positive appearance. Lovetolie has comes up with an idea. Newspapers very often make use of diagrams which don't start with zero on their y-axis. For them it might be a kind of magnifying the course of the figures, maybe just mathematical ignorance without any ulterior motives. But Dr. Packoflies is a staticitician and he knows better: It's not just a matter of making things look more impressive, but it's a serious statical error. But both men know, that most shareholders as well as other regular folks will not discover the error and that they are lead around by the nose.
Both are satisfied with their work, but after a while Dr. Packoflies comes up with another of his splendid ideas, which will further glorify the imaginativeness and inventiveness of their - as they know - incompetent management:
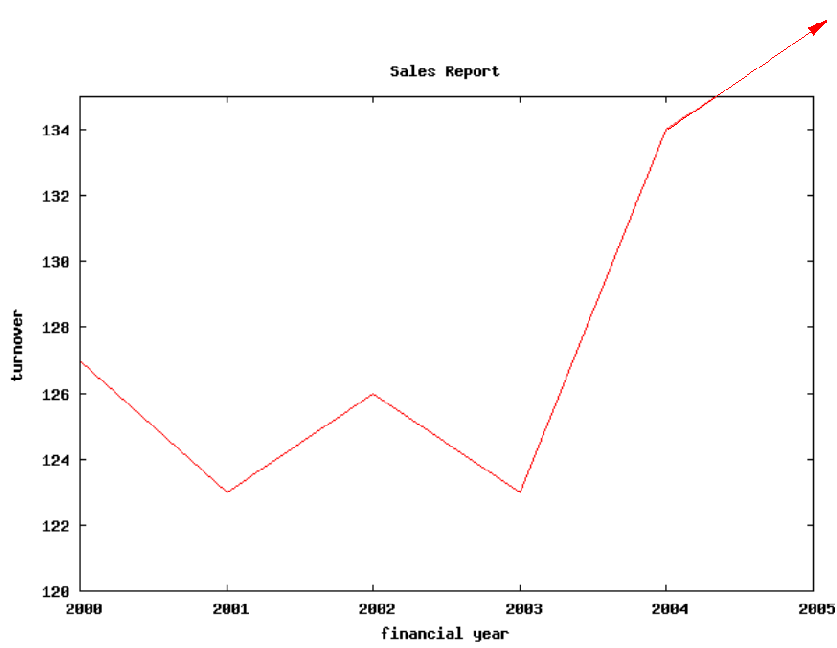
Lovetolie has another interesting suggestion of improvement. He things it will be more impressive for their board of directors and for the shareholders, if they compressed the x-axis:
In case the board of directors wouldn't approve of their suggestion, they had another idea up their sleeves: They could hide the slumps in sales completely by summing up the years in pairs. :
| Year |
Sales in Millions of Euro |
| 2000
- 2001 |
230,40 |
| 2002
- 2003 |
250,13 |
| 2004
- 2005 |
271,87 |